When 03/2019 Type Software
Overview
I requested a copy of the data held about my attendence from my University, I was provided with a huge CSV of data about my activity at University, and I thought it'd be cool to visualise it to better understand it.Project
At my HE institution, virtually all your interaction with the University is handled by NFC smart-cards, as is likely true at most Universities. Whether you’re tapping into lectures, opening faculty-specific doors, going through the library turnstiles or anything else, this is linked to your student card.
Linking this to online transactions like signing into the University’s VLE or using online resources for research papers or Box of Broadcasts gives faculty staff an easy way to check if you’re engaging with your subject, but if you request a copy of this data, it allows you to work out some interesting stats.
Building
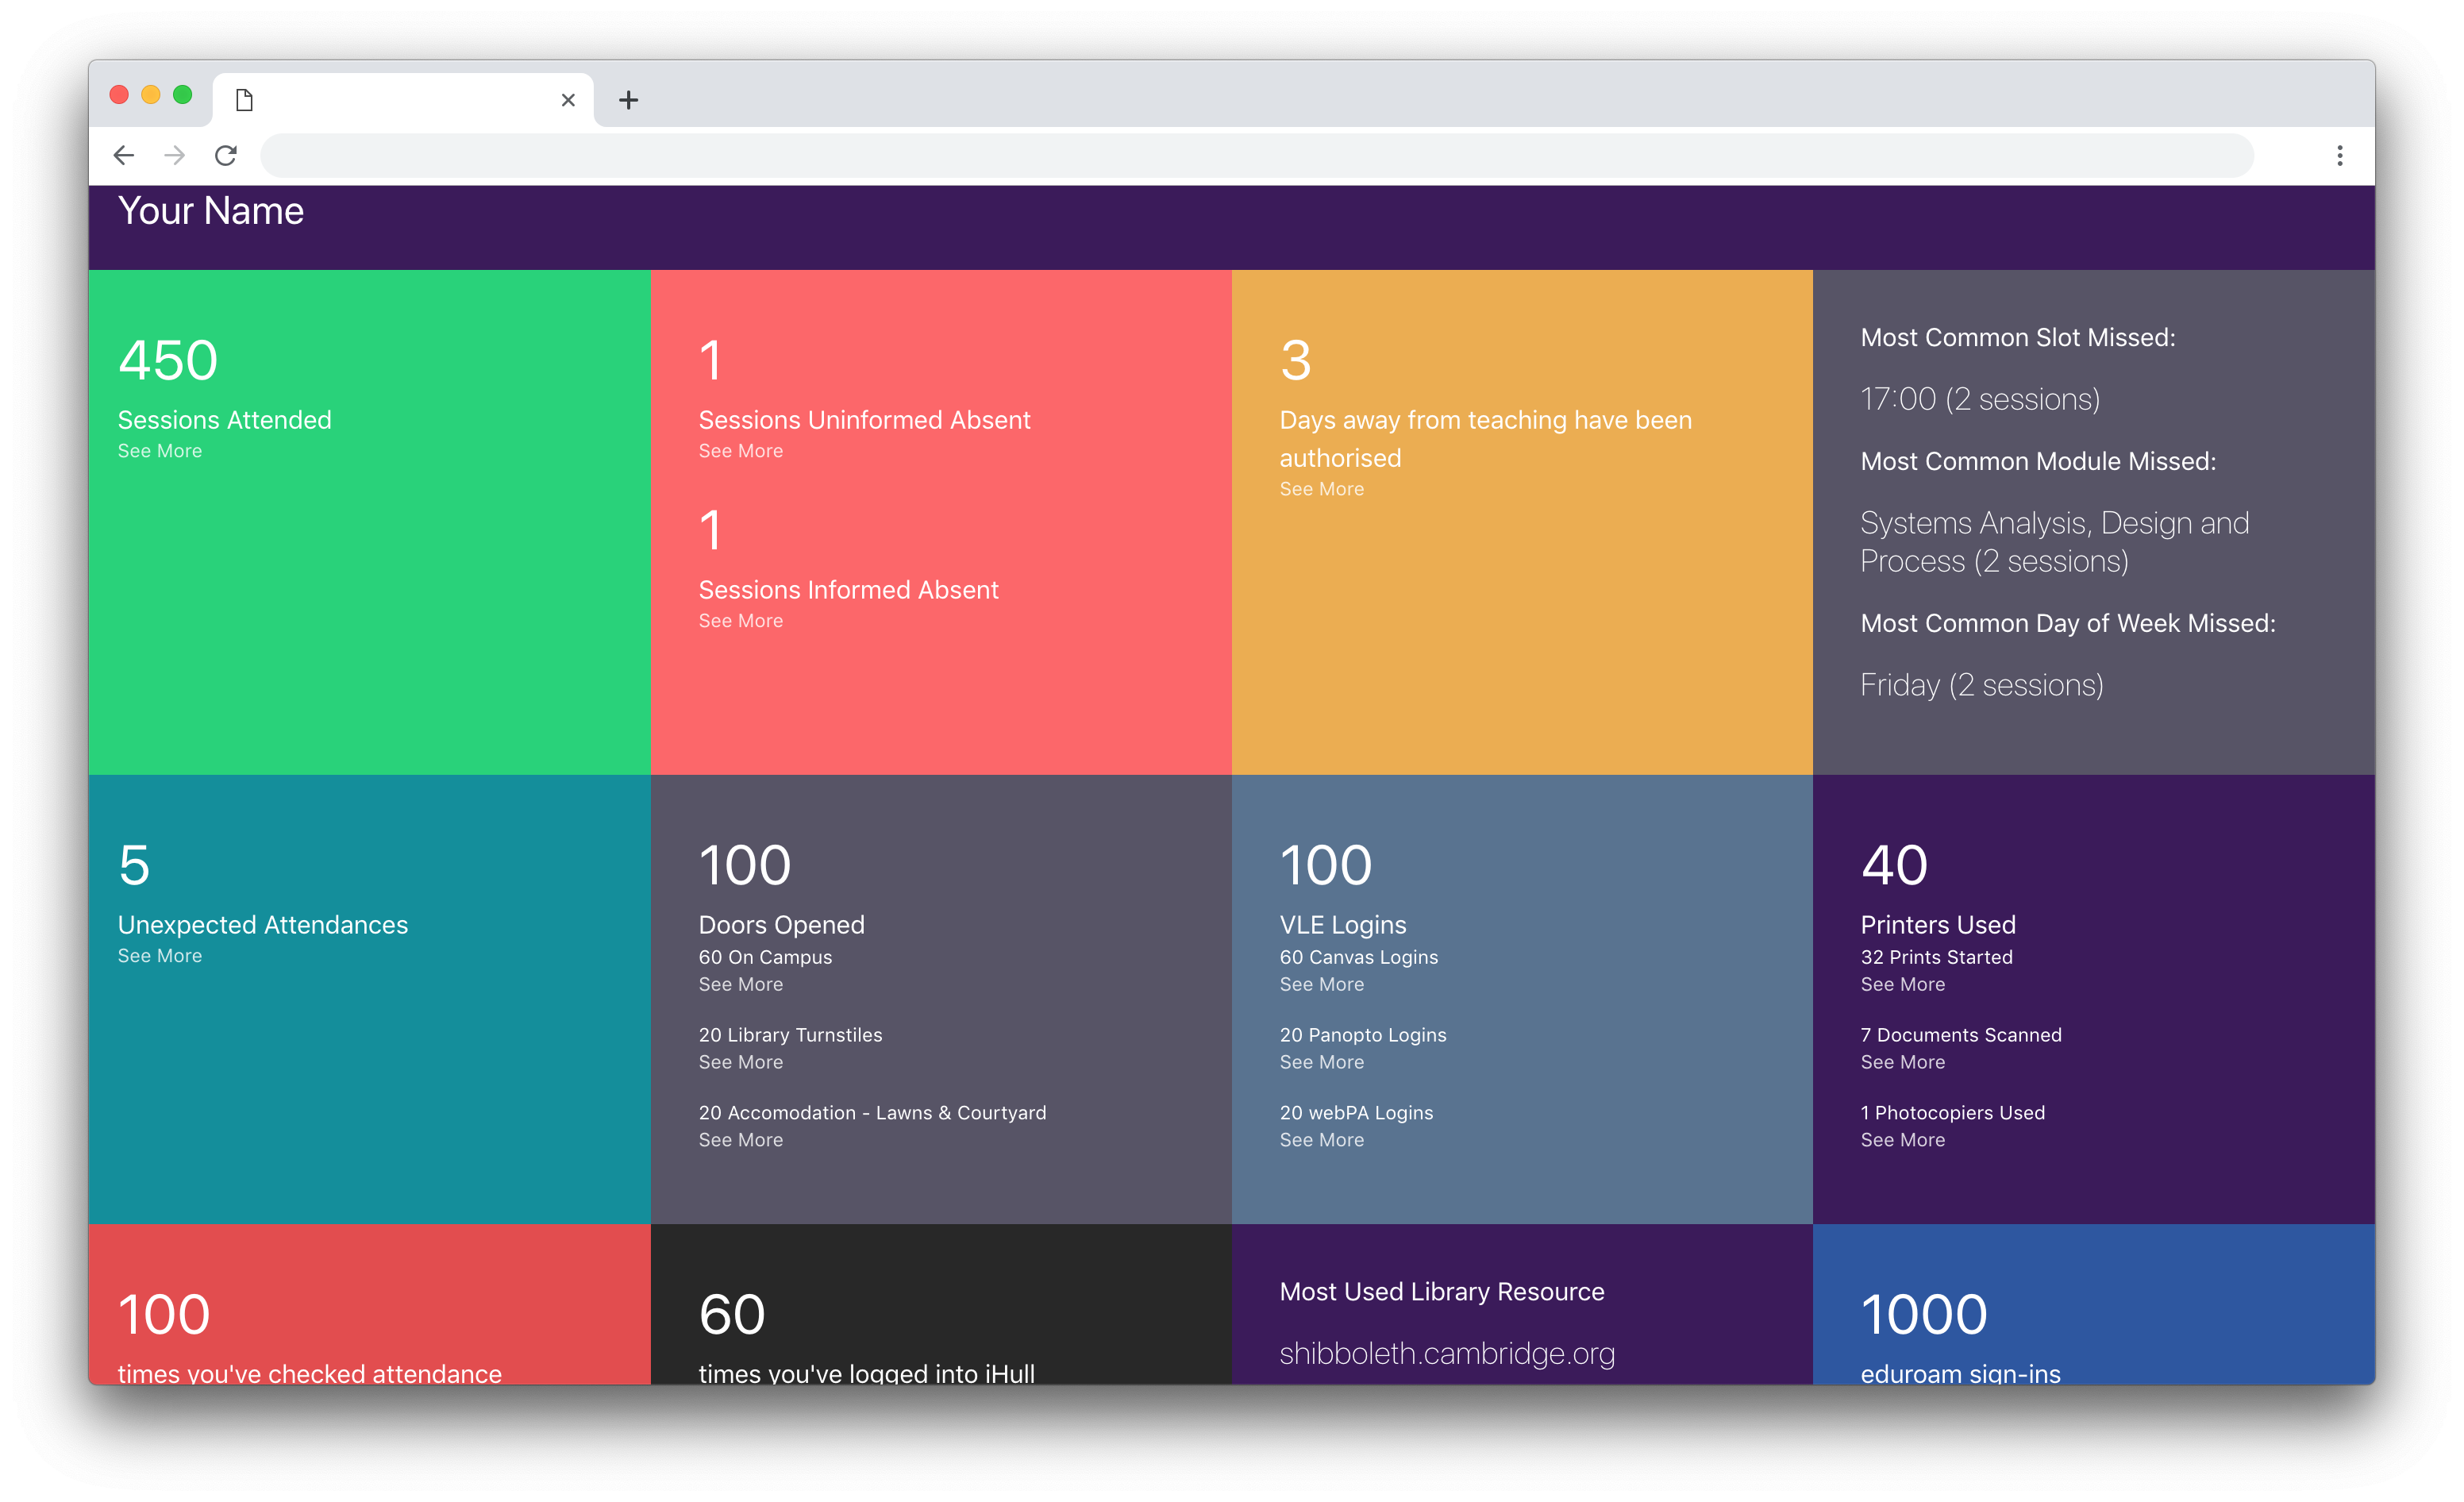
The application is a Node Express application that takes uploaded CSVs and converts them to JSON objects, which are then processed and broken down by categories, analytics are performed before it’s passed back to express and shown in the front-end, with the original data file being deleted from the server immediately.
All the code is open-source and available on GitHub and I have a live instance that is deployed by Zeit Now’s Continuous Integration. Both the source code and the live instance are linked at the bottom of this page, so you can either use it online or spin up your own application instance super easily.
This application was designed for the data output produced for the specific data types used by the University of Hull’s SEAtS analytics instance, however it can easily be forked and adjusted for other institutions.
Tools Used
- Application is written in Node.js
- Front-end is expressJS
- Deployment/CI managed by Zeit Now